Teaching and research: A zero-sum game?
There is a long history of research investigating the relationship between research aptitude and teaching ability, within both an individual and collective context. In the aftermath of the 2014 REF, David Morris digs more deeply in to the relationship between NSS and REF – or research and teaching, with some surprising results and some new data to share.
This article is more than 10 years old
Data|
David Morris is the Vice Chancellor's policy adviser at the University of Greenwich and former Deputy Editor of Wonkhe. He writes in a personal capacity.
One common anecdotal complaint of students studying at universities is the perception that their education is only a secondary priority to academic research. Students are not alone in this complaint, with research output regularly taking precedent over teaching expertise in the criteria for academic promotion and prestige.
There is a long history of research investigating the relationship between research aptitude and teaching ability, within both an individual and collective context. The results appear to be at best inconclusive. Whilst there is little evidence to suggest that teaching and research actively inhibit each other, there are also too many outside factors to conclude that there is a mutually supportive relationship.
Nonetheless, commitments to ‘excellence’ in both education and research are usually the top two objectives of many universities’ strategic plans. The ‘stock’ activities of most academics suggest an assumed synergy, although this varies significantly between disciplines. Some universities and academic departments go to great pains to ensure students are closely engaged with research, whilst others conduct research and education as parallel but very separate exercises. What is clear is that with limited resources and growing pressure for accountability and success, institutions regularly have to make choices about where their priorities might lie.
The aftermath of REF 2014 gives us an opportunity to understand which universities have been most successful by the major benchmarks for both teaching and research. Comparing and contrasting institutions’ relative success at these metrics can give us an insight into the balance between education and research in different institutions and the relative importance devoted to each.
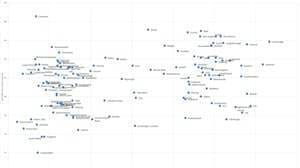
Figure 1 plots UK HEIs on a graph comparing their REF 2014 GPA score, weighted for intensity, and their NSS 2014 results by the Times Good University Guide (GUG) method (an un-weighted average of the 7 ‘banks’ of questions). Unsurprisingly, there is a tendency for higher NSS scores to mirror higher REF scores, with the most prestigious research universities tending to attract tending to attract the most successful students and staff, as well as being better endowed with funding and facilities for high-end teaching and research.

Nonetheless, from this graph we can begin to get a sense of where some institutions’ priorities and strengths appear to lie. The graph shows a clear split into what we might call ‘research divisions’, roughly along pre-1992 and post-1992 lines (with some notable anomalies). If we look to the top right of each group we can identify those institutions that were most successful on the NSS and the REF. It’s no surprise to see Cambridge, Oxford and Imperial College London heading up that list in the top set, but in the second bundle we might identify Aston, Lincoln and Oxford Brookes as strong dual-performers.
Even more interesting is identifying those institutions that appear to have set a clear priority of either education or research. In the top group, institutions such as UCL, KCL, LSE and Edinburgh appear to have geared their efforts towards the REF, whereas Surrey, Bath, Bangor and Keele appear to have focused much more on education and strong NSS scores. Similarly, in the second group we find Liverpool Hope and City University having a research focus, whilst Coventry, Northampton and Chichester a student experience focus.
Such assessments and insights must be laden with cautions. Both the REF and the NSS are very controversial, incomplete and problematic measures of both research and teaching respectively, and the sheer diversity of UK higher education institutions means that there is a vast array of outside factors that we might want to control for when making comparisons and drawing conclusions. For example, institutions in London appear to be significantly disadvantaged in the NSS, whilst the discipline mix of institutions goes a long way to influencing their relative success in the REF.
One way of controlling for the combined effects of size, income, pre-existing research intensity, prestige, and student body that is more precise than our ‘two division’ model above is to break our comparisons into TRAC peer groups. Doing so also gives us a sense of where institutions might expect themselves to be in comparison to those that are of similar size, income and research capacity, thereby introducing a degree of benchmarking into the exercise and allowing us to identify more trends from outside the traditional ‘top’ performers.
Figures 2 through to 7 in the spreadsheet below show institutions by their TRAC group ranking in the NSS and REF (smaller values indicate higher performance). Although only 2 institutions in TRAC group G appear in the REF Intensity data, making it not possible to produce a graph for group G (arts institutions). Similarly, a small number of institutions that submitted to the REF do not have NSS data, such as postgraduate-only institutions. Figure 2 below shows TRAC group A.
 Points in the bottom left of each graph are strong performers in both the NSS and REF. Those in the top left are strong in the REF but not the NSS, and those in the bottom right vice-versa. Those in the top right performed poorly in both the NSS and the REF in comparison to their TRAC group peers, some of which are arguably on an unfair playing field (such as St George’s London).
From these TRAC group comparisons we can pull out the following lists:
[table id=20 /]
Such crude analysis is by no means a way into firm conclusions or fair comparisons. There are simply too many factors at play within individual institutions, as well as too many ways to take issue with both the REF and NSS metrics, to pass final judgements on institutional ‘performance’ and success or failure.
Nonetheless, policy makers, managers, academics and student representatives might find this insight a useful starting point in asking questions about how their institutions are prioritising and making choices. The data can only take us so far. We might want to ask staff and students at UCL, Westminster and Aberystwyth whether they perceive that teaching is being neglected for research, and ask those at Bath, Cumbria and Leicester whether they believe that research is being ignored for a better ‘student experience’. And is chasing higher scores in both the REF and NSS actually having a detrimental effect on the real essence of both academic teaching and scholarship?
In times of ever constrained funding and ever greater pressure to perform, it strikes me that institutions need to work more adeptly on harmonising the complex relationship between their research and education activities. As writers such as Stefan Collini have noted, this varies a great deal between academic disciplines, and the complex symbiosis of scholarly activity needs to be understood independently of blunt REF and NSS scores. Yet for better or worse, modern public accountability methods will always demand an output metric of some sort. The challenge for the higher education sector is to maximise the dual effectiveness of education and research and to invest resources and efforts where it will benefit both, rather than neglect one for the other.
With the data uploaded alongside this article, I’d be interested to know how readers feel this method of analysis can be developed further to assist universities and policy actors.
Download the full data set and accompanying figures here.
Related articles

Can a dashboard solve higher education planning?
David Kernohan | Data | 16/09/26

Everything you ever wanted to know about TRAC
David Kernohan | Data | 18/08/26

A bumper crop of higher education entrants, but is university becoming less popular among the better off?
David Kernohan | Data | 13/08/26

The NSS shows us that students still seem to like higher education
David Kernohan | Data | 9/07/26

What can GCSE performance tell us about salaries aged 27?
David Kernohan | Data | 25/06/26

Graduate Outcomes, 2023–24
David Kernohan | Data | 5/06/26